What is the median value of the data displayed in the follow

This topic has expert replies
User avatar
Elite Legendary Member
Posts: 3991
Joined: Fri Jul 24, 2015 2:28 am
Location: Las Vegas, USA
Thanked: 19 times
Followed by:37 members
[GMAT math practice question]

What is the median value of the data displayed in the following frequency table?
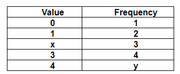
Image
1) x=2
2) y=5

User avatar
Elite Legendary Member
Posts: 3991
Joined: Fri Jul 24, 2015 2:28 am
Location: Las Vegas, USA
Thanked: 19 times
Followed by:37 members

by Max@Math Revolution » Thu Mar 15, 2018 11:40 pm
=>

Forget conventional ways of solving math questions. For DS problems, the VA (Variable Approach) method is the quickest and easiest way to find the answer without actually solving the problem. Remember that equal numbers of variables and independent equations ensure a solution.

The first step of the VA (Variable Approach) method is to modify the original condition and the question. We then recheck the question.

If y = 1, the median is x.
If y = 2, the median is ( x + 3 ) / 2
If 3 ≤ y ≤ 9, the median is 3.
If y = 10, the median is ( 3 + 4 ) / 2 = 3.5
If y ≥ 10, the median is 4.

Thus, the condition 2) is sufficient.

Therefore, the answer is B.

Answer: B