
BREAKING: Target Test Prep releases Brand New 2026 On Demand GMAT prep course

Redeem

The table above shows the number of residents in each of two

This topic has expert replies
Moderator
Posts: 7187
Joined: Thu Sep 07, 2017 4:43 pm
Followed by:23 members
Image

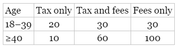
The table above shows the number of residents in each of two age groups who support the use of each type of funding for a city initiative. What is the probability that a person randomly selected from among the 250 residents polled is younger than 40, or supports a type of funding that includes a tax, or both?

A. 1/5
B. 8/25
C. 12/25
D. 3/5
E. 4/5


OA D


Source: Official Guide

Source: — Problem Solving |

Legendary Member
Posts: 2214
Joined: Fri Mar 02, 2018 2:22 pm
Followed by:5 members

by deloitte247 » Sat Dec 28, 2019 11:08 pm
Let total residents/population = 250
Let residents younger than 40 = A
Let resident with tax funding = B
Probability that a person randomly selected from among the total residents polled is younger than 40 or supports a type of funding that includes tax or both?
$$=\frac{\left(AuB\right)}{Total}$$
$$Where\ AuB=A+B-AnB$$
A = residents younger than 40 = 20 + 30 + 30 = 80
B = residents with tax funding = 20 + 10 + 30 + 60 = 120
(AnB) = residents that are both younger and includes tax funcing = 20 + 30 = 50
Therefore, AuB = 80 + 120 - 50 = 150
$$Therefore,\ probability=\frac{150}{250}=\frac{3}{5}$$

Answer = option D
















