Live GMAT classes with Target Test Prep start Nov 21 and Nov 22. First class free.

See classes
Target Test Prep · GMAT

Choose how you want to prepare

Learn live with an expert or move at your own pace. Every option includes the complete TTP study system.

Newsweek Readers’ Choice Awards 2026 winner: Target Test Prep, #1 Test Prep

Target Test Prep was voted #1 Best Test Prep in the 2026 Newsweek Readers’ Choice™ Awards.

★★★★★5.0563 reviews
GMATLiveTeachStarts Nov 22
Josh Braslow, Target Test Prep GMAT expert
LIVE ONLINE CLASSES

Get Ready for GMAT Test Day Faster with Live Online Classes

with Josh Braslow, 20+ years in test prep

Nov 22 · Josh Braslow
Sun · 9:30 AM to 12:30 PM ET
Included
40 hours of live online classes + 6 months of TTP OnDemand
  • Attend the first class for free
  • Every class is recorded, so you never fall behind
View classes & enroll
Limited seats availableTarget Test Prep
EALiveTeachOnDemandStart anytime
EXECUTIVE ASSESSMENT

Target Test Prep EA OnDemand

Self-paced EA prep. Study on your schedule.

EXECUTIVE ASSESSMENT

with

165+ EA score guarantee
$05-day trial no automatic billing
Schedule
Included
40 hours of live online classes plus six months of access to the complete TTP EA OnDemand course.
  • 165+ EA Score Guarantee
  • 4,100+ Quant, Verbal, and Integrated Reasoning practice questions
  • 400+ hours of in-depth video lessons
  • 3,000+ step-by-step video solutions
View EA class & enroll Start free 5-day trial
Limited cohort · enrollment openTrial includes full course accessTarget Test Prep
GMATOnDemandStart anytime
SELF-PACED MASTERCLASS

Target Test Prep GMAT OnDemand

Complete access from day one. Study on your schedule.

715+ score guarantee
$0to start then $127/mo
  • Personalized study plan and analytics
  • Thousands of lessons and practice questions

The graph of the equation xy = k,

Expert replies
by boomgoesthegmat » Tue May 03, 2016 2:49 pm
Timer
00:00
Your answer
Difficulty–

right wrong

Pick an answer to see how members did

Image

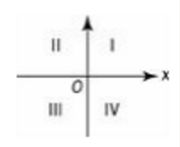
The graph of the equation xy = k, where k < 0, lies in which two of the quadrants shown above?

A) I and II
B) I and III
C) II and III
D) II and IV
E) III and IV

OA: D
Join the discussion
Source: — Problem Solving |

by OptimusPrep » Tue May 03, 2016 7:19 pm
boomgoesthegmat wrote:Image

The graph of the equation xy = k, where k < 0, lies in which two of the quadrants shown above?

A) I and II
B) I and III
C) II and III
D) II and IV
E) III and IV

OA: D
We are given that xy = -ve. This means x and y will have different signs.

Hence when x > 0, y < 0 {Quadrant IV}
And when x < 0, y > 0 {Quadrant II}

Correct Option: D
Join the discussion

by [email protected] » Mon Mar 12, 2018 5:22 pm
Hi All,

We're told that the graph of the equation (X)(Y) = K, where K < 0. We're asked for the two quadrants in which that graph would lie. This question can be solved by TESTing VALUES.

We're told that K is NEGATIVE. Let's TEST K = -2
(X)(Y) = -2

There are LOTS of different 'pairs' of values for X and Y that would fit this equation (since X and Y aren't necessarily integers). Here are two co-ordinates that are possible:
(X, Y)
(2, -1) --> this is in Quadrant 4
(-2, 1) --> this is in Quadrant 2

Final Answer: D

GMAT assassins aren't born, they're made,
Rich
Contact Rich at [email protected]
Image
Join the discussion