Live GMAT classes with Target Test Prep start Nov 21 and Nov 22. First class free.

See classes
Target Test Prep · GMAT

Choose how you want to prepare

Learn live with an expert or move at your own pace. Every option includes the complete TTP study system.

Newsweek Readers’ Choice Awards 2026 winner: Target Test Prep, #1 Test Prep

Target Test Prep was voted #1 Best Test Prep in the 2026 Newsweek Readers’ Choice™ Awards.

★★★★★5.0563 reviews
GMATLiveTeachStarts Nov 22
Josh Braslow, Target Test Prep GMAT expert
LIVE ONLINE CLASSES

Get Ready for GMAT Test Day Faster with Live Online Classes

with Josh Braslow, 20+ years in test prep

Nov 22 · Josh Braslow
Sun · 9:30 AM to 12:30 PM ET
Included
40 hours of live online classes + 6 months of TTP OnDemand
  • Attend the first class for free
  • Every class is recorded, so you never fall behind
View classes & enroll
Limited seats availableTarget Test Prep
EALiveTeachOnDemandStart anytime
EXECUTIVE ASSESSMENT

Target Test Prep EA OnDemand

Self-paced EA prep. Study on your schedule.

EXECUTIVE ASSESSMENT

with

165+ EA score guarantee
$05-day trial no automatic billing
Schedule
Included
40 hours of live online classes plus six months of access to the complete TTP EA OnDemand course.
  • 165+ EA Score Guarantee
  • 4,100+ Quant, Verbal, and Integrated Reasoning practice questions
  • 400+ hours of in-depth video lessons
  • 3,000+ step-by-step video solutions
View EA class & enroll Start free 5-day trial
Limited cohort · enrollment openTrial includes full course accessTarget Test Prep
GMATOnDemandStart anytime
SELF-PACED MASTERCLASS

Target Test Prep GMAT OnDemand

Complete access from day one. Study on your schedule.

715+ score guarantee
$0to start then $127/mo
  • Personalized study plan and analytics
  • Thousands of lessons and practice questions

Problem of how many time a graph intercepts the x-axis

Expert replies
by eliewadi » Mon Oct 21, 2013 7:36 pm
Image

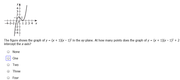
Hi this question is from one of the GMAT official practice tests. Any one can help explain how you get to the answer of "One".

thank you
Join the discussion
Source: — Problem Solving |

by sahilchaudhary » Mon Oct 21, 2013 8:55 pm
The new graph that would be formed will be 2 points upwards from the original graph. So, imagine picking up the graph and placing it 2 points upwards. It will intersect y-axis at y = 3 (Put x = 0 in the new equation and you will get y = 3).

So, it will intersect x-axis at only 1 point, which will be on the negative side of X axis.

Hope that helps!
Sahil Chaudhary
If you find this post helpful, please take a moment to click on the "Thank" icon.
https://www.sahilchaudhary007.blocked
Join the discussion

by theCodeToGMAT » Mon Oct 21, 2013 9:47 pm
y = (x+1)(x-1)^2

Put x=0, y = 1 (Also, it's clear in graph)

y = (x+1)(x-1)^2 + 2

Put x=0, y=3 (So, graph has moved "2" points above its position")

So, graph of line will intersect "x" axis only at its path towards quadrant "3rd"

So, "ONE"
R A H U L
Join the discussion

by [email protected] » Mon Oct 21, 2013 11:52 pm
Hi eliewadi,

There are 3 ways that you could solve this problem:

1) Physically graph the new line; pick values for x, solve for y and graph. You should realize pretty quickly that the figure you graph will be the exact same shape as the original drawing, just moved "up" the graph by 2.

2) Set the equation of the line = 0 and solve for x. Whatever value(s) you find will be the solution(s).

3) Know the "graphing rule" behind this question. By "adding 2 to the right side the equation", you will increase the value of "y" by 2. The graph will be the same shape, it's just that each point on the original graph with be "2" above it's current position.

GMAT assassins aren't born, they're made,
Rich
Contact Rich at [email protected]
Image
Join the discussion

by eliewadi » Tue Oct 22, 2013 6:39 am
Thank you all that's very helpful and I get it but I have one more question.

Rich response shows 3 different ways. Can someone show me how to do option 2.

If I take the original equation of y=(x+1)(x-1)^2 I can set y=0 and solve for x. I would then get x=1 or x=-1. In this case I can say that the graph intercepts x-axis at 2 points 1 and -1.

However, I tried it with the new equation of y=(x+1)(x-1)^2+2 but I couldn't get anywhere. Can someone please show me how to solve for x here.

Thank you.
Eli
Join the discussion

by mevicks » Tue Oct 22, 2013 7:51 am
Image

The figure shows the graph of y = (x + 1)(x - 1)² in the xy-plane. At how many points does the graph of y = (x + 1)(x - 1)² + 2 intercept the x-axis?

A) None
B) One
C) Two
D) Three
E) Four
Note:
The effect of the constant term c on a graph:-
Changing "c" only changes the vertical position of the graph, not it's shape.

This can be tested for Linear, constant, Quadratic/Parabola and Cubic equations by trying out some sample values (knowledge is useful on graphing questions):

The graph of y = 3 is raised two units above the graph y = 1
Image

Similarly, the graph of y = x + 6 is 5 units above the graph of y = x + 1
Image

For a parabola : https://www.mathsisfun.com/algebra/quadr ... graph.html
Try changing the Value of C on that page to see what is happening to the graph

On the same lines, our cubic equation (highest power of x is 3 after multiplying) when moved up by 2 points would have only a single x-axis intercept.
Image


[spoiler]Answer: B) One [/spoiler]
Join the discussion