




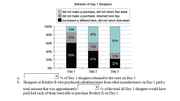
On days 1 through 4 of a recent week, product X was out of stock at Retailer R. Day 1 shoppers are those who came to Retailer R on day 1 of that week seeking Product X. for each of the first 3 days of that week, the graph shows the subsequent behavior of all the day 1 shoppers who came to Retailer R seeking Product X on that day. Shoppers at Retailer R who purchased a different item in lieu of Product X paid an average of 30% more for the item.
From each drop-down menu, select the option that creates the most accurate statement based on the information provided.
From each drop-down menu, select the option that creates the most accurate statement based on the information provided.
Last edited by Anaira Mitch on Tue Sep 12, 2017 2:35 am, edited 1 time in total.




















