Actually thats a good point. I think all of these methods work (including matrix) but identifying the best method is key. Whitney, do you have any tips on how to identify problems as "layered" problem?
[quote="Whitney Garner"][quote="yellowho"]Hi Tania. I was being confusing. What I was referring to is 3 dimensions of something example:
In a class 40% are Male 60% Female, 20% of Male and 50% of female take calculus. Of the people who takes calculus 15% got higher than a B.
So the matrix would be: 1) M/F vs Calculus/Not Calculus 2) Higher than B/Not HIgher vs M/F 3) M/F vs Higher than B/Not higher than B.
I've seen these types of problem quite a bit during practice just wondering how people are handling them.
[/quote]
Although I completely agree that the Venn Diagram approach is wonderful when people can belong to any of 3 groups (think students who can take French, Spanish or German and any mix of the 3), that actually doesn't work with the problem you have outlined above. What you have outlined is less of a grouping and more of a layering (within the class there are boys and girls, then within those groups are calc and non-calc students, and then within the calc are B+ and less than Bs).
One of the best methods to deal with a problem that has more than 2 "layers" is to build a tree. So let me edit your question a bit to offer something that we can compute:
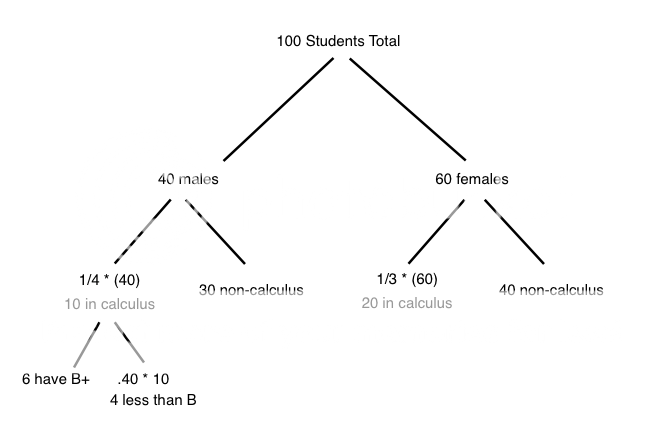
In a certain class, 40% of the students are Male and 60% are Female. 1/4 of Male students and 1/3 of female take calculus. If 2/3 of all students taking calculus score a B or better, and 40% of Males in Calculus scored less than a B, then approximately what percent of Female students scored a B or better in their calculus class?
A 5%
B 10%
C 15%
D 20%
E 30%
So we can draw the following tree (picking a simple 100 for the total percent):
[img]
https://i1200.photobucket.com/albums/bb3 ... 5340PM.png[/img]
Once we fill out our Tree, we can read that 6 males scored a B or greater. But we are told that 2/3 of students taking calculus score Bs or better. Using the tree, we see that 10 boys and 20 girls take calculus. This means 30 total calculus students. Of these, 2/3 or 20 score a B or better. We have accounted for 6 or those with the boys, so the girls will have to make up the other 14. Now to answer we need the following ratio:
Females scoring a B or better in Calc / Total Females = 14/60 = 7/30 = .23333 = approx 20%. The answer is B.
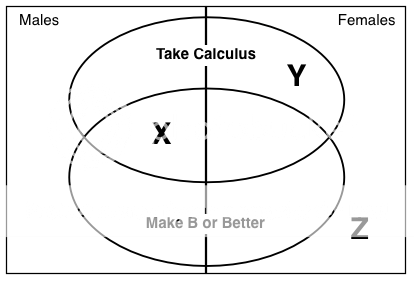
Just for completeness, the following would be the "Venn" Diagram needed to show the information you provided:
[img]
https://i1200.photobucket.com/albums/bb3 ... 0612PM.png[/img]
Where X would be males who take calc AND get a B or better, Y would be females who take calc but get less than a B, and Z would be females who do not take Calc and do not get a B (in whatever it is they do take).
And note that this Venn Diagram:
[img]
https://s3.postimage.org/kb5mhdedl/venn3.jpg[/img]
Does not include information pertaining to the grades of students so would not help us solve. In fact, it would be better collapsed to 2 mutually exclusive groups (Male/Female and Calc/NoCalc) and put into an overlapping sets matrix (table).
Tricky question but VERY interesting to think about - Great Post!!
:D
Whit[/quote]