


Timer
00:00
Answers
A
B
C
D
E
Stats
Difficulty—
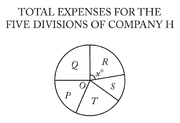
The figure above represents a circle graph of Company H's total expenses broken down by the expenses for each of its five divisions. If O is the center of the circle and if Company H's total expenses are $5,400,000, what are the expenses for Division R?
(1) x = 94
(2) The total expenses for Divisions S and T are twice as much as the expenses for Division R.
[spoiler]OA=A[/spoiler]
Source: Official Guide



















