

BREAKING: Target Test Prep releases Brand New 2026 On Demand GMAT prep course

Redeem

In New Zealand, the grape is a long-established crop, bu

Data Sufficiency, Multi-Source Reasoning, Table Analysis, Graphics Interpretation, Two-Part Analysis
Expert replies
by Anaira Mitch » Tue Sep 12, 2017 6:30 pm
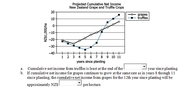
In New Zealand, the grape is a long-established crop, but the truffle-an edible fungus that grows on the roots of certain trees-became a commercial crop in the 1980s. The graph represents projected cumulative net income for grape and truffle crops through the end of the year, in thousands of New Zealand dollars per hectare (NZ$1,000/ha), for each of the first 11 years since planting. Cumulative net income is equal to total revenue from crop sales for the years since planting minus total investment costs over those same years.
From each drop-down menu, select the option that creates the most accurate statement about these projections based on the given information.
Image
Join the discussion
Source: — Data Insights |

by Anaira Mitch » Wed Sep 13, 2017 10:26 am
Any 1?
Join the discussion

by DavidG@VeritasPrep » Wed Sep 13, 2017 11:17 am
Anaira Mitch wrote:In New Zealand, the grape is a long-established crop, but the truffle-an edible fungus that grows on the roots of certain trees-became a commercial crop in the 1980s. The graph represents projected cumulative net income for grape and truffle crops through the end of the year, in thousands of New Zealand dollars per hectare (NZ$1,000/ha), for each of the first 11 years since planting. Cumulative net income is equal to total revenue from crop sales for the years since planting minus total investment costs over those same years.
From each drop-down menu, select the option that creates the most accurate statement about these projections based on the given information.


Image
The first question asks us to find when the cumulative income for truffles was at its lowest level. So we're tracking those black squares. The lowest level appears to be at about -$35,000 at the end of Year 5.
Veritas Prep | GMAT Instructor

Veritas Prep Reviews
Save $100 off any live Veritas Prep GMAT Course
Join the discussion

by DavidG@VeritasPrep » Wed Sep 13, 2017 11:21 am
Anaira Mitch wrote:In New Zealand, the grape is a long-established crop, but the truffle-an edible fungus that grows on the roots of certain trees-became a commercial crop in the 1980s. The graph represents projected cumulative net income for grape and truffle crops through the end of the year, in thousands of New Zealand dollars per hectare (NZ$1,000/ha), for each of the first 11 years since planting. Cumulative net income is equal to total revenue from crop sales for the years since planting minus total investment costs over those same years.
From each drop-down menu, select the option that creates the most accurate statement about these projections based on the given information.

Image
The second question asks us to project the income for grapes at the end of year 12, assuming that income would grow at the same rate it had from years 8 to 11. So we're tracking those white circles now. In Year 8, it looks like the income for grapes was around -$7000. In Year 11 it looks to be about +$7000, so over the course of four years, we're talking about an increase of $14,000, and a rate of 14,000/4 = $3500/year. If there were a $3500 increase from Year 11 to Year 12, you're looking at income of approximately 7000 + 3500 = $10,500. So whatever option was closest to that value is the one I'd go with.
Veritas Prep | GMAT Instructor

Veritas Prep Reviews
Save $100 off any live Veritas Prep GMAT Course
Join the discussion
















