Hi lukaswelker,
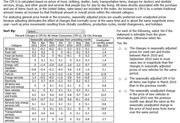
Based on the information in the table and the way in which the 3 questions are worded, it looks like you answered the first 2 questions correctly, but erred on the third.
Notice the wording; we're asked to consider the "seasonally UNADJUSTED change in price." Most of the information in the table is month-by-month ADJUSTED change in price. The only column that deals with the UNADJUSTED change in price is the last column and it's for a 12-MONTH period, without giving us data on any individual month. With this information, there's no way to infer anything about any individual month. So the correct answer to the third question would have to be NO.
The take-away from this type of prompt is that you have to pay very careful attention to the wording, so that you pull the proper information from the table.
GMAT assassins aren't born, they're made,
Rich