Survey for Food Popularity

This topic has expert replies
Junior | Next Rank: 30 Posts
Posts: 14
Joined: Tue May 20, 2014 3:01 am
Thanked: 1 times
Followed by:1 members

Survey for Food Popularity

by avanti@gmat » Sat Jul 19, 2014 8:20 am
A Survey was conducted to determine the popularity of 3 foods. The data collected for 75 students is as below:
48 like pizza
45 like hoagies
58 like tacos
28 like pizza and hoagies
37 like hoagies and tacos
40 like pizza and tacos
25 like all three
What is the number of students who like one or none of the 3 foods?
1) 4
2) 16
3) 17
4) 20
5) 23
Source: — Problem Solving |

User avatar
Legendary Member
Posts: 1100
Joined: Sat May 10, 2014 11:34 pm
Location: New Delhi, India
Thanked: 205 times
Followed by:24 members

by GMATinsight » Sat Jul 19, 2014 8:49 am
avanti@gmat wrote:A Survey was conducted to determine the popularity of 3 foods. The data collected for 75 students is as below:
48 like pizza
45 like hoagies
58 like tacos
28 like pizza and hoagies
37 like hoagies and tacos
40 like pizza and tacos
25 like all three
What is the number of students who like one or none of the 3 foods?
1) 4
2) 16
3) 17
4) 20
5) 23
Please check the solution as mentioned below

Image

Answer: Option D
"GMATinsight"Bhoopendra Singh & Sushma Jha
Most Comprehensive and Affordable Video Course 2000+ CONCEPT Videos and Video Solutions
Whatsapp/Mobile: +91-9999687183 l [email protected]
Contact for One-on-One FREE ONLINE DEMO Class Call/e-mail
Most Efficient and affordable One-On-One Private tutoring fee - US$40-50 per hour

User avatar
GMAT Instructor
Posts: 15539
Joined: Tue May 25, 2010 12:04 pm
Location: New York, NY
Thanked: 13060 times
Followed by:1906 members
GMAT Score:790

by GMATGuruNY » Sat Jul 19, 2014 7:20 pm
A survey was conducted to determine the popularity of 3 food among students. The data collected from 75 students is summarized as below

48 like Pizza
45 like Hoagies
58 like tacos
28 like pizza and hoagies
37 like hoagies and tacos
40 like pizza and tacos
25 like all three food

What is the number of students who like none or only one of the foods ?

A. 4
B. 16
C. 17
D. 20
E. 23
Draw a VENN DIAGRAM representing the following:
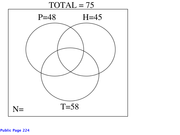
75 Total
48 like pizza
45 like hoagies
58 like tacos
N = ?

Image

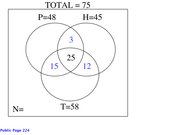
Complete the Venn diagram by working from the INSIDE OUT.

25 like all 3 foods:
Image

28 like pizza and hoagies
37 like hoagies and tacos
40 like pizza and tacos

Subtracting from these figures the 25 who like all 3 foods, we get:
Image

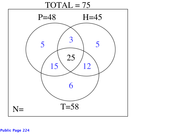
Subtracting the values in the diagram from P=48, H=45, and T=58, we get:
Image

Subtracting the values in the diagram from Total = 75, we get:
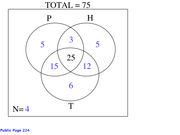
Image

Thus:
Only P + Only H + Only T + N = 5 + 5 + 6 + 4 = 20.

The correct answer is D.
Private tutor exclusively for the GMAT and GRE, with over 20 years of experience.
Followed here and elsewhere by over 1900 test-takers.
I have worked with students based in the US, Australia, Taiwan, China, Tajikistan, Kuwait, Saudi Arabia -- a long list of countries.
My students have been admitted to HBS, CBS, Tuck, Yale, Stern, Fuqua -- a long list of top programs.

As a tutor, I don't simply teach you how I would approach problems.
I unlock the best way for YOU to solve problems.

For more information, please email me (Mitch Hunt) at [email protected].
Student Review #1
Student Review #2
Student Review #3