Timer
00:00
Answers
A
B
C
D
E
Stats
Difficulty—
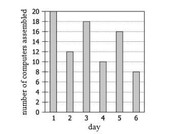
The graph shows the number of computers assembled during each of 6 consecutive days.From what day to the next day was the percent change in the number of computers assembled the greatest in magnitude ?
A. From Day 1 to Day 2
B. From Day 2 to Day 3
C. From Day 3 to Day 4
D. From Day 4 to Day 5
E. From Day 5 to Day 6
D