


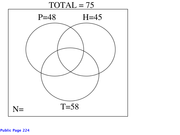
Draw a VENN DIAGRAM representing the following:A survey was conducted to determine the popularity of 3 food among students. The data collected from 75 students is summarized as below:
48 like Pizza
45 like Hoagies
58 like tacos
28 like pizza and hoagies
37 like hoagies and tacos
40 like pizza and tacos
25 like all three food
What is the number of students who like none or only one of the foods?
A. 4
B. 16
C. 17
D. 20
E. 23
75 Total
48 like pizza
45 like hoagies
58 like tacos
N = ?
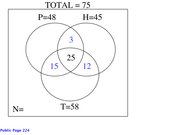
Complete the Venn diagram by working from the INSIDE OUT.
25 like all 3 foods:

28 like pizza and hoagies
37 like hoagies and tacos
40 like pizza and tacos
Subtracting from these figures the 25 who like all 3 foods, we get:
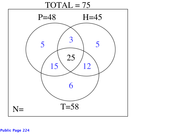
Subtracting the values in the diagram from P=48, H=45, and T=58, we get:
Subtracting the values in the diagram from Total = 75, we get:
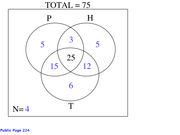
Thus:
Only P + Only H + Only T + N = 5 + 5 + 6 + 4 = 20.
The correct answer is D.


