BREAKING: Target Test Prep releases Brand New 2026 On Demand GMAT prep course

Redeem

According to the chart (OG16)

Expert replies
by boomgoesthegmat » Thu May 19, 2016 3:42 pm
Image

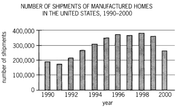
According to the chart shown, which of the following is closest to the median annual number of shipments of manufactured homes in the United States for the years from 1990 to 2000, inclusive?

A) 250,000
B) 280,000
C) 310,000
D) 325,000
E) 340,000

OA: C
Join the discussion
Source: — Problem Solving |

by [email protected] » Thu May 19, 2016 3:56 pm
Hi boomgoesthegmat,

This question asks us for the MEDIAN measure in the table. Since there are 11 values, we need to find the one that is 6th BIGGEST (or 6th smallest, if you prefer to think in those terms). You can do this visually - either way, you'll find that the value for 1994 is the one that we're looking for. That value is a little bit greater than 300,000...

Final Answer: C

GMAT assassins aren't born, they're made,
Rich
Contact Rich at [email protected]
Image
Join the discussion