-
Target Test Prep 20% Off Flash Sale is on! Code: FLASH20
Redeem
The Next-Gen GMAT: Table Analysis
 I recently received a request to do more on Integrated Reasoning, so here you go: a Table Analysis problem. These problems will consist of some kind of complex table (sometimes with 20+ rows and / or 6 to 7 columns!) and one three-part question. We have to answer all three parts correctly in order to earn any points. The one were going to try has been released as a sample question on the mba.com website.
Try the problem
Lets try out the question: here is the link to the problem. Just in case that link changes, you can also click on this link to go to the next-gen GMAT website, and then, toward the bottom of the page, click on the Table Analysis link. Were going to try the second problem (with the table labeled Percentage of Population Visiting).
Note: when you are done, do NOT click the next button. Just leave it up on the screen and come back here. Also, Im going to reproduce the table below, but you wont be able to sort the data and thats a key feature in answering these question types. So while you can technically do the problem below, I strongly recommend that you go look at the original using the link above.
Set your timer for 2.5 minutes and go!
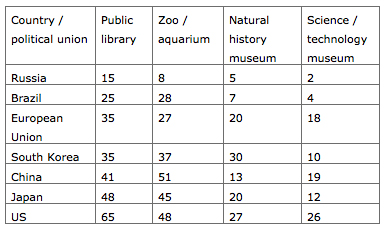
Percentage of Population Visiting Selected Cultural Institutions, Single Year
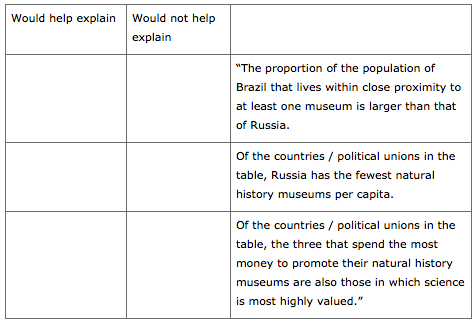
For each of the following statements, select Would help explain if it would, if true, help to explain some of the information in the table. Otherwise select Would not help explain.
The Solution
Believe it or not, this is one of the smaller tables. Whether you have a huge table or a smaller one, though, youre only going to be using a subset of the given information sometimes only a tiny percentage of the given data. (I remember one table with perhaps 20 rows, and I only needed to use 3 of them in order to answer all three parts of the question!)
The question asks us whether the statements, if true, would help to explain the information in the table. This feels like a critical reasoning-type question but its not exactly like any of the existing CR types. In this case, if a statement makes me think, hey, yeah, if this statement is true, then I can see why the data in the table is what it is, then Ill pick would help explain. Otherwise, Ill pick would not help explain."
Heres the first statement:
The proportion of the population of Brazil that lives within close proximity to at least one museum is larger than that of Russia.
Lets see. They mention only Brazil and Russia, so I only need to look at those two rows. Luckily, theyre already right next to each other in the table.
The statement says that, in Brazil, people are more likely to live in close proximity to a museum, which naturally would make it easier to visit a museum. There are two types of museums listed on the table: history and science. In both cases, the data indicates that a greater percentage of the Brazilian population than the Russian population visited a museum. That makes sense, given that more people in Brazil live closer to the museums.
Select would help explain for statement 1.
Heres the second statement:
Of the countries / political unions in the table, Russia has the fewest natural history museums per capita.
Per capita. What does that mean? Literally, it means for each person or per person. You might read a statistic that says the per capita annual consumption of apples is 8. On average, the statistic is telling us, one person eats 8 apples each year.
So this statement is telling us that Russia has the fewest natural history museums per person compared to the other countries / political unions in the table. Maybe Russia has 1 natural history museum for every 1 million people while South Korea has 1 natural history museum for every 1,000 people. If that were true, what would you expect to happen?
In general, youd expect people to be more likely to visit natural history museums in South Korea (because there are more museums available relative to the population size) and fewer people to visit natural history museums in Russia (because there are fewer museums available relative to the population size).
Okay, does this match the information given in the table? Russia has the fewest history museums per capita and, yes, of the locations listed, Russia has the lowest percentage of the population visiting history museums! Select would help explain for statement 2.
And our third statement:
Of the countries / political unions in the table, the three that spend the most money to promote their natural history museums are also those in which science is most highly valued.
Hmm. So, if a country spends a bunch of money to promote its history museums, what might we expect to happen? Well, if the promotion is successful, that would likely mean that many people would visit those museums. I think I need to re-sort the data for this one.
Click to sort by natural history museum. The top four countries are South Korea (30%), US (27%), and Japan and the European Union (tied at 20%). If science is also most highly valued in those countries, we would expect high percentages of people visiting the science museums as well. Is that happening?
No. South Korea is #1 in history museum visits but only 10% of the population visits the science museums. For Japan, its only 12%. The top two areas for science museum visits are the US (which is on our top history museum list as well) and China (which is not on our top history museum list).
This statement doesnt seem to go along with the given data. Select would not help explain for statement 3.
The answers to the three statements are Would help, Would help, Would NOT help.
Key Takeaways for Table Analysis questions:
(1) You will NOT need to use all of the data, even when given a smaller table like the one in this problem. Dont try to read the table thoroughly or take in all of the data just know what kind of information is available.
(2) The ability to re-sort the data is critically important to our ability to answer these questions efficiently. In general, were going to be trying to save time on Table Analysis questions, as they dont tend to require as much reading as some of the other question types. Learn how to decide when and how to re-sort the data.
(3) If you do get a really big (20+ row) table, dont panic and dont think youre going to need extra time. Youll still be given just three statements. Youre still only going to need a fraction of the data presented sometimes only a very small fraction. Ignore all that extra data!
* All quotes copyright and courtesy of the Graduate Management Admissions Council. Usage of this material does not imply endorsement by GMAC.
Recent Articles
Archive
- April 2024
- March 2024
- February 2024
- January 2024
- December 2023
- November 2023
- October 2023
- September 2023
- July 2023
- June 2023
- May 2023
- April 2023
- March 2023
- February 2023
- January 2023
- December 2022
- November 2022
- October 2022
- September 2022
- August 2022
- July 2022
- June 2022
- May 2022
- April 2022
- March 2022
- February 2022
- January 2022
- December 2021
- November 2021
- October 2021
- September 2021
- August 2021
- July 2021
- June 2021
- May 2021
- April 2021
- March 2021
- February 2021
- January 2021
- December 2020
- November 2020
- October 2020
- September 2020
- August 2020
- July 2020
- June 2020
- May 2020
- April 2020
- March 2020
- February 2020
- January 2020
- December 2019
- November 2019
- October 2019
- September 2019
- August 2019
- July 2019
- June 2019
- May 2019
- April 2019
- March 2019
- February 2019
- January 2019
- December 2018
- November 2018
- October 2018
- September 2018
- August 2018
- July 2018
- June 2018
- May 2018
- April 2018
- March 2018
- February 2018
- January 2018
- December 2017
- November 2017
- October 2017
- September 2017
- August 2017
- July 2017
- June 2017
- May 2017
- April 2017
- March 2017
- February 2017
- January 2017
- December 2016
- November 2016
- October 2016
- September 2016
- August 2016
- July 2016
- June 2016
- May 2016
- April 2016
- March 2016
- February 2016
- January 2016
- December 2015
- November 2015
- October 2015
- September 2015
- August 2015
- July 2015
- June 2015
- May 2015
- April 2015
- March 2015
- February 2015
- January 2015
- December 2014
- November 2014
- October 2014
- September 2014
- August 2014
- July 2014
- June 2014
- May 2014
- April 2014
- March 2014
- February 2014
- January 2014
- December 2013
- November 2013
- October 2013
- September 2013
- August 2013
- July 2013
- June 2013
- May 2013
- April 2013
- March 2013
- February 2013
- January 2013
- December 2012
- November 2012
- October 2012
- September 2012
- August 2012
- July 2012
- June 2012
- May 2012
- April 2012
- March 2012
- February 2012
- January 2012
- December 2011
- November 2011
- October 2011
- September 2011
- August 2011
- July 2011
- June 2011
- May 2011
- April 2011
- March 2011
- February 2011
- January 2011
- December 2010
- November 2010
- October 2010
- September 2010
- August 2010
- July 2010
- June 2010
- May 2010
- April 2010
- March 2010
- February 2010
- January 2010
- December 2009
- November 2009
- October 2009
- September 2009
- August 2009

