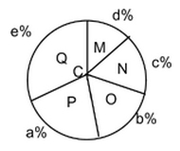
Mechmeera wrote:Breakup of total expenses of the five divisions M, N, O, P and Q of company X
Note -: The figure shown is not necessarily to scale.
The figure above shows a circle graph. The circle has a centre of C and gives the division wise breakup of the total expenses of company X in terms of percentages. How many of the five divisions have an expense which is more than the average (arithmetic mean) of the expenses of the five divisions?
(1) a > 19 > b > c > d > e
(2) a > 21 > b > c > d > e
Target question: How many of the five divisions have an expense which is more than the average (arithmetic mean) of the expenses of the five divisions?
This is a great candidate for REPHRASING the target question.
IMPORTANT: If we add the percentages (a%, b%, c%, d%, and e%), we get
100%
So, the average percent share =
100%/5 = 20%
So, we can REPHRASE the target question....
REPHRASED target question: How many of the five divisions have MORE than 20% of the TOTAL expenses
Aside: We have a free video with tips on rephrasing the target question: https://www.gmatprepnow.com/module/gmat- ... cy?id=1100
Now onto the statements....
Statement 1: a > 19 > b > c > d > e
We know that b, c, d and e have less than 19% of the total expenses, which means they each have less than 20% of the TOTAL expenses.
If b, c, d and e each = less than 19%, then b+c+d+e is less than (4)(19%)
(4)(19%) = 74%, which means
division a must comprise more than 26% percent of the TOTAL expenses.
So,
exactly 1 division has MORE than 20% of the TOTAL expenses
Since we can answer the
REPHRASED target question with certainty, statement 1 is SUFFICIENT
Statement 2: a > 21 > b > c > d > e
There are several values of a, b, c, d and e that satisfy statement 2. Here are two:
Case a: a = 23, b = 20.5, c = 19.5, d = 19 and e = 18. In this case,
2 divisions have MORE than 20% of the TOTAL expenses
Case b: a = 62, b = 11, c = 10, d = 9 and e = 8. In this case,
1 division has MORE than 20% of the TOTAL expenses
Since we cannot answer the
REPHRASED target question with certainty, statement 2 is NOT SUFFICIENT
Answer =
A
Cheers,
Brent