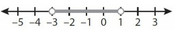
The number line above represents which of the following inequalities?
A. \(x < 1\)
B. \(-6 < 2x < 2\)
C. \(-9 < 3x < 6\)
D. \(1 < 2x < 3\)
E. \(x > -3\)
The OA is B
Source: Manhattan Prep
BREAKING: Target Test Prep releases Brand New 2026 On Demand GMAT prep course
Redeem
 Featured Course
Scott Woodbury-Stewart’s private virtual classroom — 400 hours of master-class video lessons for the GMAT Focus Edition.

The number line above represents -3 < x < 1. Multiplying the inequality by 2, we get -6 < 2x < 2. Thus, the correct answer is B.swerve wrote:
The number line above represents which of the following inequalities?
A. \(x < 1\)
B. \(-6 < 2x < 2\)
C. \(-9 < 3x < 6\)
D. \(1 < 2x < 3\)
E. \(x > -3\)
The OA is B
Source: Manhattan Prep

We see that the number line above represents all the values between -3 and 1 (excluding the two endpoints); therefore, the inequality representing this is:swerve wrote:
The number line above represents which of the following inequalities?
A. \(x < 1\)
B. \(-6 < 2x < 2\)
C. \(-9 < 3x < 6\)
D. \(1 < 2x < 3\)
E. \(x > -3\)
The OA is B
Source: Manhattan Prep


We can also solve the question by testing the answer choicesswerve wrote:
The number line above represents which of the following inequalities?
A. \(x < 1\)
B. \(-6 < 2x < 2\)
C. \(-9 < 3x < 6\)
D. \(1 < 2x < 3\)
E. \(x > -3\)
The OA is B
Source: Manhattan Prep

New here Create free account


