BTGmoderatorDC wrote: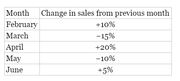
The table above shows the percent of change from the previous month in Company X's sales for February through June of last year. A positive percent indicates that Company X's sales for that month increased from the sales for the previous month, and a negative percent indicates that Company X's sales for that month decreased from the sales for the previous month. For which month were the sales closest to the sales in January?
A. February
B. March
C. April
D. May
E. June
Let the sales in January = 100.
Sales in February = 100 + (10% of 100) = 100 + 10 = 110.
Sales in March = 110 - (15% of 110) ≈ 110 - 16 = 94.
Sales in April = 94 + (20% of 94) ≈ 94 + 19 = 113.
Sales in May = 113 - (10% of 113) ≈ 113 - 11 = 102.
Since the sales in June increase by 5% and thus will be greater than 102, the month whose sales are closest to $100 figure in January = May.
The correct answer is
D.
Private tutor exclusively for the GMAT and GRE, with over 20 years of experience.
Followed here and elsewhere by over 1900 test-takers.
I have worked with students based in the US, Australia, Taiwan, China, Tajikistan, Kuwait, Saudi Arabia -- a long list of countries.
My students have been admitted to HBS, CBS, Tuck, Yale, Stern, Fuqua -- a long list of top programs.
As a tutor, I don't simply teach you how I would approach problems.
I unlock the best way for YOU to solve problems.
For more information, please email me (Mitch Hunt) at
[email protected].
Student Review #1
Student Review #2
Student Review #3


