
BREAKING: Target Test Prep releases Brand New 2026 On Demand GMAT prep course

Redeem

Target Test Prep · GMAT

Choose how you want to prepare

Learn live with an expert or move at your own pace. Every option includes the complete TTP study system.

★★★★★5.0559 reviews
GMATLiveTeach 7 seats left
Chris Peckover
NEXT LIVE COHORT

Oct 13 to Jan 7, 2027

with Chris Peckover

Schedule
Tue, Thu · 8:00 to 10:00 PM ET
Included
40 live hours + 6 months of GMAT OnDemand
  • Live instruction and real-time questions
  • Class recordings and assigned practice
View class & enroll
Limited cohort · enrollment openTarget Test Prep
EALiveTeach 5 seats left
Logan Thompson
EXECUTIVE ASSESSMENT

Sep 6 to Dec 6, 2026

with Logan Thompson

Schedule
Sun · 9:30 AM to 12:30 PM ET
Included
40 hours of live online classes plus six months of access to the complete TTP EA OnDemand course.
  • 165+ EA Score Guarantee
  • 4,100+ Quant, Verbal, and Integrated Reasoning practice questions
  • 400+ hours of in-depth video lessons
  • 3,000+ step-by-step video solutions
View EA class & enroll
Limited cohort · enrollment openTarget Test Prep
GMATOnDemand Start anytime
SELF-PACED MASTERCLASS

Target Test Prep GMAT OnDemand

Complete access from day one. Study on your schedule.

715+ score guarantee
$0to start then $127/mo
  • Personalized study plan and analytics
  • Thousands of lessons and practice questions

Compare the format, schedule, and included access before enrolling. Prices and seat counts shown reflect the supplied offer details.

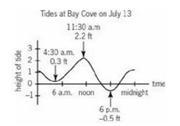
The graph above shows the height of the tide

Expert replies
by boomgoesthegmat » Sun May 01, 2016 9:30 am

Timer

00:00

Answers

A

B

C

D

E

Stats

Difficulty

Image

The graph above shows the height of the tide, in feet, above or below a baseline. Which of the following is closest to the difference, in feet, between the heights of the highest and lowest tides on July 13 at Bay Cove?

A) 1.7
B) 1.9
C) 2.2
D) 2.5
E) 2.7

OA: E
Join the discussion
Source: — Problem Solving |

by [email protected] » Sun May 01, 2016 10:45 pm
Hi boomgoesthegmat,

This question is really just about pulling the relevant information from the chart and doing the basic arithmetic to answer the question that's asked.

We're asked to choose the answer that closest to the DIFFERENCE between the highest tide and lowest tide in the table.

Highest Tide: 2.2 ft
Lowest Tide: -0.5 ft

Difference = (2.2) - (-0.5) = 2.7 ft

Final Answer: E

GMAT assassins aren't born, they're made,
Rich
Contact Rich at [email protected]
Image
Join the discussion

boomgoesthegmat wrote:Image

The graph above shows the height of the tide, in feet, above or below a baseline. Which of the following is closest to the difference, in feet, between the heights of the highest and lowest tides on July 13 at Bay Cove?

A) 1.7
B) 1.9
C) 2.2
D) 2.5
E) 2.7

OA: E

From the graph, we can see the following information:

Highest tide at 11:30 AM = 2.2 ft
Lowest tide at 6:00 PM = - 0.5 ft

Difference = 2.2 - (-0.5) = 2.7 ft

Correct Option: E
Join the discussion

boomgoesthegmat wrote:Image

The graph above shows the height of the tide, in feet, above or below a baseline. Which of the following is closest to the difference, in feet, between the heights of the highest and lowest tides on July 13 at Bay Cove?

A) 1.7
B) 1.9
C) 2.2
D) 2.5
E) 2.7
We are given a graph in which the y-axis displays the height of the tide. We must determine the difference between the heights of the highest and lowest tides.

highest tide = 2.2 feet

lowest tide = -0.5 feet

Thus, the difference between the heights is 2.2 - (-0.5) = 2.2 + 0.5 = 2.7 feet.

Answer: E

Jeffrey Miller
Head of GMAT Instruction
[email protected]

Image

See why Target Test Prep is rated 5 out of 5 stars on BEAT the GMAT. Read our reviews
Join the discussion