Problem of how many time a graph intercepts the x-axis
This topic has expert replies
- sahilchaudhary
- Master | Next Rank: 500 Posts
- Posts: 153
- Joined: Mon Apr 11, 2011 7:13 am
- Location: India
- Thanked: 22 times
- Followed by:7 members
- GMAT Score:540
The new graph that would be formed will be 2 points upwards from the original graph. So, imagine picking up the graph and placing it 2 points upwards. It will intersect y-axis at y = 3 (Put x = 0 in the new equation and you will get y = 3).
So, it will intersect x-axis at only 1 point, which will be on the negative side of X axis.
Hope that helps!
So, it will intersect x-axis at only 1 point, which will be on the negative side of X axis.
Hope that helps!
Sahil Chaudhary
If you find this post helpful, please take a moment to click on the "Thank" icon.
https://www.sahilchaudhary007.blocked
If you find this post helpful, please take a moment to click on the "Thank" icon.
https://www.sahilchaudhary007.blocked
- theCodeToGMAT
- Legendary Member
- Posts: 1556
- Joined: Tue Aug 14, 2012 11:18 pm
- Thanked: 448 times
- Followed by:34 members
- GMAT Score:650
y = (x+1)(x-1)^2
Put x=0, y = 1 (Also, it's clear in graph)
y = (x+1)(x-1)^2 + 2
Put x=0, y=3 (So, graph has moved "2" points above its position")
So, graph of line will intersect "x" axis only at its path towards quadrant "3rd"
So, "ONE"
Put x=0, y = 1 (Also, it's clear in graph)
y = (x+1)(x-1)^2 + 2
Put x=0, y=3 (So, graph has moved "2" points above its position")
So, graph of line will intersect "x" axis only at its path towards quadrant "3rd"
So, "ONE"
R A H U L
GMAT/MBA Expert
- [email protected]
- Elite Legendary Member
- Posts: 10392
- Joined: Sun Jun 23, 2013 6:38 pm
- Location: Palo Alto, CA
- Thanked: 2867 times
- Followed by:511 members
- GMAT Score:800
Hi eliewadi,
There are 3 ways that you could solve this problem:
1) Physically graph the new line; pick values for x, solve for y and graph. You should realize pretty quickly that the figure you graph will be the exact same shape as the original drawing, just moved "up" the graph by 2.
2) Set the equation of the line = 0 and solve for x. Whatever value(s) you find will be the solution(s).
3) Know the "graphing rule" behind this question. By "adding 2 to the right side the equation", you will increase the value of "y" by 2. The graph will be the same shape, it's just that each point on the original graph with be "2" above it's current position.
GMAT assassins aren't born, they're made,
Rich
Thank you all that's very helpful and I get it but I have one more question.
Rich response shows 3 different ways. Can someone show me how to do option 2.
If I take the original equation of y=(x+1)(x-1)^2 I can set y=0 and solve for x. I would then get x=1 or x=-1. In this case I can say that the graph intercepts x-axis at 2 points 1 and -1.
However, I tried it with the new equation of y=(x+1)(x-1)^2+2 but I couldn't get anywhere. Can someone please show me how to solve for x here.
Thank you.
Eli
-
- Master | Next Rank: 500 Posts
- Posts: 269
- Joined: Thu Sep 19, 2013 12:46 am
- Thanked: 94 times
- Followed by:7 members
Note:
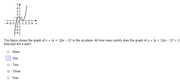
The figure shows the graph of y = (x + 1)(x - 1)² in the xy-plane. At how many points does the graph of y = (x + 1)(x - 1)² + 2 intercept the x-axis?
A) None
B) One
C) Two
D) Three
E) Four
The effect of the constant term c on a graph:-
Changing "c" only changes the vertical position of the graph, not it's shape.
This can be tested for Linear, constant, Quadratic/Parabola and Cubic equations by trying out some sample values (knowledge is useful on graphing questions):
The graph of y = 3 is raised two units above the graph y = 1
Similarly, the graph of y = x + 6 is 5 units above the graph of y = x + 1
For a parabola : https://www.mathsisfun.com/algebra/quadr ... graph.html
Try changing the Value of C on that page to see what is happening to the graph
On the same lines, our cubic equation (highest power of x is 3 after multiplying) when moved up by 2 points would have only a single x-axis intercept.
[spoiler]Answer: B) One [/spoiler]