The table above shows the number of residents in each of two

This topic has expert replies
Moderator
Posts: 7187
Joined: Thu Sep 07, 2017 4:43 pm
Followed by:23 members
Image

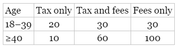
The table above shows the number of residents in each of two age groups who support the use of each type of funding for a city initiative. What is the probability that a person randomly selected from among the 250 residents polled is younger than 40, or supports a type of funding that includes a tax, or both?

A. 1/5
B. 8/25
C. 12/25
D. 3/5
E. 4/5


OA D


Source: Official Guide

Legendary Member
Posts: 2214
Joined: Fri Mar 02, 2018 2:22 pm
Followed by:5 members

by deloitte247 » Sat Dec 28, 2019 11:08 pm
Let total residents/population = 250
Let residents younger than 40 = A
Let resident with tax funding = B
Probability that a person randomly selected from among the total residents polled is younger than 40 or supports a type of funding that includes tax or both?
$$=\frac{\left(AuB\right)}{Total}$$
$$Where\ AuB=A+B-AnB$$
A = residents younger than 40 = 20 + 30 + 30 = 80
B = residents with tax funding = 20 + 10 + 30 + 60 = 120
(AnB) = residents that are both younger and includes tax funcing = 20 + 30 = 50
Therefore, AuB = 80 + 120 - 50 = 150
$$Therefore,\ probability=\frac{150}{250}=\frac{3}{5}$$

Answer = option D