help with IR graph EA practice exam
This topic has expert replies
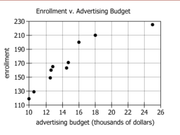
The graph shows the relationship between a child care center's advertising budget and its annual enrollment over the previous 10 years.
Based on the information provided, from each drop-down menu, select the option that completes each statement in the most accurate manner.
During one of the years depicted in the graph, the total revenue was $1,890,000, or $9,000 per child. In this year, the advertising budget was...
Options : 10,000, 12,000, 16,000 or 18,000
can someone help explain why the answer is 18,000
GMAT/MBA Expert
- [email protected]
- Elite Legendary Member
- Posts: 10392
- Joined: Sun Jun 23, 2013 6:38 pm
- Location: Palo Alto, CA
- Thanked: 2867 times
- Followed by:511 members
- GMAT Score:800
Hi jarty13,
We're told that the graph shows the relationship between a child care center's advertising budget and its annual enrollment over the previous 10 years and that during one of the years depicted in the graph, the total revenue was $1,890,000 (or $9,000 per child). We're asked for the advertising budget during that year.
To start, you should notice that there are 10 'dots' on the graph (representing the previous 10 years at the child care center). We know that for one of those dots, $9,000 per child was collected.... and on the left-axis of the graph, we see the various enrollment numbers. This means that $9,000 multiplied by one of those numbers will give us the revenue that was listed (re: $1,890,000).
You might find it easier to just divide the total revenue by the revenue-per-student:
$1,890,000/$9,000 = 1890/9 = 210 students
Knowing that, we can work 'across' the graph and find the dot at the $18,000 mark.
Final Answer: [spoiler]$18,000[/spoiler]
GMAT assassins aren't born, they're made,
Rich