AbeNeedsAnswers wrote: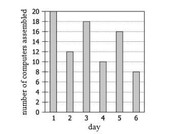
The graph shows the number of computers assembled during each of 6 consecutive days.From what day to the next day was the percent change in the number of computers assembled the greatest in magnitude ?
A. From Day 1 to Day 2
B. From Day 2 to Day 3
C. From Day 3 to Day 4
D. From Day 4 to Day 5
E. From Day 5 to Day 6
Let's test each answer choice:
A) From Day 1 to Day 2
|(12 - 20)/20| x 100 = |-8/20| x 100 = 40%
B) From Day 2 to Day 3
[(18 - 12)/12] x 100 = |6/12| x 100 = 50%
C) From Day 3 to Day 4
|(10 - 18)/18| x 100 = |-8/18| x 100 = 44.44%
D) From Day 4 to Day 5
[(16 - 10)/10] x 100 = |6/10| x 100 = 60%
E) From Day 5 to Day 6
|(8 - 16)/16| x 100 = |-8/16| x 100 = 50%
Answer:
D