swerve wrote: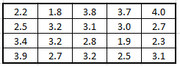
The table above shows the GPA of 20 students last semester. If the average (arithmetic mean) of the 20 GPAs is 2.95 and the standard deviation is 0.6, how many of the grades are more than 1.5 standard deviations away from the mean?
A. None
B. 1
C. 2
D. 3
E. 4
Source: Veritas Prep
$$\left( {\mu \,;\,\sigma } \right) = \left( {2.95\,;\,0.6} \right)$$
$$?\,\,\,:\,\,\,\left| {{\text{grade}} - \mu } \right| > 1.5\sigma \,\,\,\,\,\,\, \Leftrightarrow \,\,\,\,\,\,\,{\text{grade}}\,\, < \,\,\mu - 1.5\sigma \,\, = \,\,2.05\,\,\,\,\underline {{\text{or}}} \,\,\,\,{\text{grade}} > \mu + 1.5\sigma = 3.85$$
$${\text{?}}\,\,{\text{ = }}\,\,4\,\,{\text{cases}}\,\,\,\left( {{\text{by}}\,\,{\text{inspection}}} \right)$$
We follow the notations and rationale taught in the GMATH method.
Regards,
Fabio.