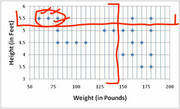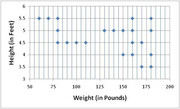
The dots on the graph represent the weight and height of the students in a certain class. Find the number of students who weigh between 50 and 150 pounds, with a height more than 5 ft.
A. 3
B. 5
C. 7
D. 8
E. 9
The OA is A.
Experts, I need your help to solve this PS question. Thanks!