The graph of the equation xy = k, where k < 0, lies in...

This topic has expert replies
Moderator
Posts: 2244
Joined: Sun Oct 29, 2017 2:08 pm
Followed by:2 members
Image

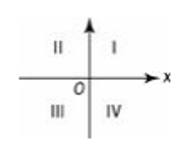
The graph of the equation xy=k, where k<0, lies in which two of the quadrants shown above?

(A) I and II.
(B) I and III.
(C) II and III.
(D) II and IV.
(E) III and IV.

The OA is D.

Please, can any expert assist me with this PS question? I don't have it clear and I appreciate if any explain it for me. Thanks.

User avatar
GMAT Instructor
Posts: 555
Joined: Wed Oct 04, 2017 4:18 pm
Thanked: 180 times
Followed by:12 members

by EconomistGMATTutor » Sat Nov 25, 2017 8:50 am
Hello AAPL.

Let's see your question.

As k<0, then "x" and "y" must have differents signs. The cases are:

1- x>0 and y<0, which is the quadrant IV
2- x<0 and y>0, which is the quadrant II

So, the correct answer is D .

I hope this explanation may help you.

I'm available if you'd like a follow up.

Regards,
GMAT Prep From The Economist
We offer 70+ point score improvement money back guarantee.
Our average student improves 98 points.

Image