
In a survey of 200 college graduates, 30 percent said they had received student loans during their college careers, and 40 percent said they had received scholarships. What percent of those surveyed said that they had received neither student loans nor scholarships during their college careers?
1) 25 percent of those surveyed said that they had received scholarships but no loans
2) 50 percent of those surveyed who said that they had received loans also said that they had received scholarships.

5-Day Free Trial
5-day free, full-access trial TTP
Available with Beat the GMAT members only code
MORE DETAILS

Graduates' loans and scholarships
This topic has expert replies
-
LulaBrazilia
- Master | Next Rank: 500 Posts
- Posts: 116
- Joined: Tue Mar 31, 2009 10:50 am
- Followed by:1 members
-
Patrick_GMATFix

- GMAT Instructor
- Posts: 1052
- Joined: Fri May 21, 2010 1:30 am
- Thanked: 335 times
- Followed by:98 members
Use a groups table (matrix) or Venn diagram to keep your work organized, and be careful not to let info from one statement affect how you assess the other statement. I go through the question in detail in the full solution below (taken from the GMATFix App).

-Patrick
-Patrick
- Check out my site: GMATFix.com
- To prep my students I use this tool >> (screenshots, video)
- Ask me about tutoring.
GMAT/MBA Expert
-
Brent@GMATPrepNow

- GMAT Instructor
- Posts: 16207
- Joined: Mon Dec 08, 2008 6:26 pm
- Location: Vancouver, BC
- Thanked: 5254 times
- Followed by:1268 members
- GMAT Score:770
We can solve this question using the Double Matrix Method. This technique can be used for most questions featuring a population in which each member has two characteristics associated with it.LulaBrazilia wrote:In a survey of 200 college graduates, 30 percent said they had received student loans during their college careers, and 40 percent said they had received scholarships. What percent of those surveyed said that they had received neither student loans nor scholarships during their college careers?
1) 25 percent of those surveyed said that they had received scholarships but no loans
2) 50 percent of those surveyed who said that they had received loans also said that they had received scholarships.
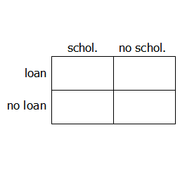
Here, we have a population of college graduates, and the two characteristics are:
- received scholarships or didn't receive scholarships
- received loans or didn't receive loans
So, we can set up our diagram as follows:
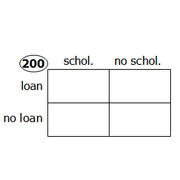
In a survey of 200 college graduates...
So, we'll add the population here:
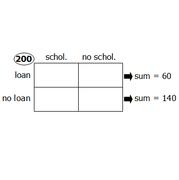
...30 percent said they had received student loans
30% of 200 = 60, so 60 students received loans, which also means 140 students received no loans.
Add this to our diagram:
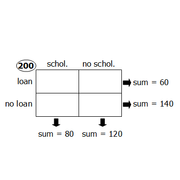
...and 40 percent said they had received scholarships
40% of 200 = 80, so 80 students received scholarships, which also means 120 students received no scholarships.
Add this to our diagram:
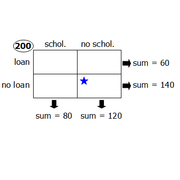
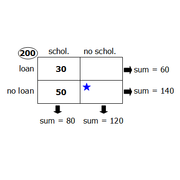
Target question: What percent of those surveyed said that they had received neither student loans nor scholarships during their college careers?
Let's place a star in the box that represents this portion of the population to remind us of our goal:
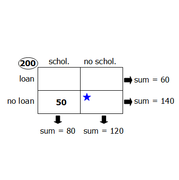
Statement 1: 25 percent of those surveyed said that they had received scholarships but no loans
25% of 200 = 50, so 50 students can be placed in the following box:
Since the boxes in the bottom row must add to 140, we can determine the value that goes in the starred box:
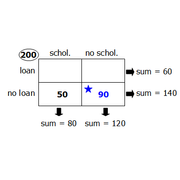
So, 90 students received neither student loans nor scholarships.
Since we can answer the target question with certainty, statement 1 is SUFFICIENT
At this point, we'll revert back to the diagram we created with the given information:
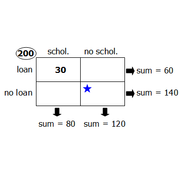
Statement 2: 50 percent of those surveyed who said that they had received loans also said that they had received scholarships.
Our diagram tells us that 60 students received loans.
50% of 60 = 30, so 30 students received loans AND scholarships
We can place this information as follows:
Since the boxes in the left-hand column row must add to 80, we can determine the value that goes in the bottom-left box:
Next, since the boxes in the bottom row must add to 140, we can determine the value that goes in the starred box:
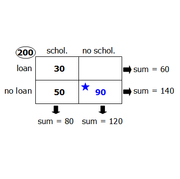
So, 90 students received neither student loans nor scholarships.
Since we can answer the target question with certainty, statement 2 is SUFFICIENT
Answer: D
Cheers,
Brent
---------------------------------
To learn more about the Double Matrix Method, watch our free video: https://www.gmatprepnow.com/module/gmat- ... ems?id=919
Once you're familiar with the technique, you can attempt these additional practice questions:
Easy Problem Solving questions
- https://www.beatthegmat.com/the-aam-aadm ... 72242.html
- https://www.beatthegmat.com/finance-majo ... 67425.html
Medium Problem Solving questions
- https://www.beatthegmat.com/probability- ... 73360.html
- https://www.beatthegmat.com/posted-speed ... 72374.html
- https://www.beatthegmat.com/motel-t271938.html
- https://www.beatthegmat.com/of-the-appli ... 70255.html
- https://www.beatthegmat.com/opening-nigh ... 64869.html
- https://www.beatthegmat.com/ds-french-ja ... 22297.html
Difficult Problem Solving questions
- https://www.beatthegmat.com/ratio-problem-t268339.html
- https://www.beatthegmat.com/overlapping- ... 65223.html
- https://www.beatthegmat.com/fractions-t264254.html
- https://www.beatthegmat.com/overlapping- ... 64092.html
- https://www.beatthegmat.com/mba/2011/05/ ... question-2
Easy Data Sufficiency questions
- https://www.beatthegmat.com/for-what-per ... 70596.html
- https://www.beatthegmat.com/ds-quest-t187706.html
Medium Data Sufficiency questions
- https://www.beatthegmat.com/sets-matrix-ds-t271914.html
- https://www.beatthegmat.com/each-of-peop ... 71375.html
- https://www.beatthegmat.com/a-manufacturer-t270331.html
- https://www.beatthegmat.com/in-costume-f ... 69355.html
- https://www.beatthegmat.com/mba/2011/05/ ... question-1
Difficult Data Sufficiency questions
- https://www.beatthegmat.com/double-set-m ... 71423.html
- https://www.beatthegmat.com/sets-t269449.html
- https://www.beatthegmat.com/mba/2011/05/ ... question-3
Brent Hanneson - Creator of GMATPrepNow.com


