4 Steps to Analyze your CATs (part 3)

Are you ready to get even more geeky on test data? :)
In the first two installments of this series, we talked about:
Part 1: Global executive reasoning and timing review
Part 2: Per-question timing review
If you havent already, start with part 1 of this series and work your way back here.
Lets continue with a deeper dive into the broad strengths and weaknesses revealed by your data.
Run your reports
Note: this article series is based on the metrics that are given in Manhattan Prep tests, but you can extrapolate to other tests that give you similar performance data.
In the Manhattan Prep system, navigate to your practice exam area and click on the link Generate Assessment Reports. The first time, run the report based solely on the most recent test that you just did; later, well aggregate data from your last two or three tests.
The Assessment Summary
The first report produced is the Assessment Summary; this report provides the percentages correct for the five main Q and V question types, as well as average timing and difficulty levels. It also gives a summary by overall Quant topic area. Heres an example; see whether you can spot any problem areas. (You may need to zoom in. Thats a lot of data!)
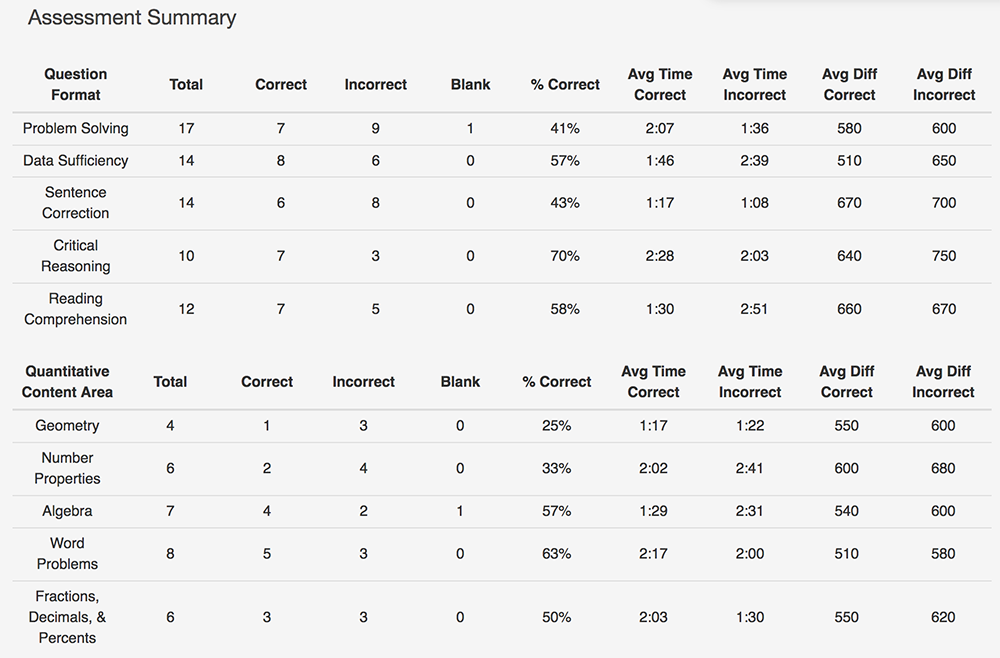
Most people will immediately say Oh, this student is much better at DS than PS. Why? Because the percentage correct is higher for DS.
Actually, that may not be an accurate takeaway for this particular set of results. Its crucial to compare three data points at once: the percentage correct, the time spent, and the difficulty levels.
Its true that the DS percentage correct is significantly higher. But look at that timing: the student is spending a lot longer on incorrect DS as well. (Almost a minute longer, on average, than correct DS!) Where does that extra time come from? Incorrect PS is averaging only about 1.5 minutes, so shes rushing on those.
Finally, check out those difficulty levels; shes actually answering much harder PS problems correctly! Whats concerning here is that the average difficulty for correct vs. incorrect PS is almost the sameand that shes rushing on incorrect PS.
Id tell this student to start looking for careless errorsis that rushing costing her points on PS? And if she is able to answer harder PS correctly, why is the DS difficulty languishing down at a 510 for the correct problems, and why is she spending so much longer on incorrect ones? She may have an issue with the DS process or strategies, or she may be second-guessing herself on DS (or both!). Id review the overall process and major strategies such as rephrasing and testing cases.
Plus, she needs to learn to cut herself off on some of the harder DS problems (that shes getting wrong anyway!). That average time of 2:39 for incorrect DS needs to come down. Shell need to investigate how to know that she should cut herself off on any particular problem. For example, if shes spent 1 minute but doesnt really understand what the question is asking, thats a great time to cut yourself off. Or if shes spent 2 minutes trying some kind of plan / approach and shes hitting a wall, thats not when you want to keep going and try something else. Thats when you cut your losses and move on.
These kinds of results should catch your eye:
- Percentages correct below approximately 50%, especially when coupled with lower average difficulty levels and higher average times. Note that I dont consider PS a straight weakness for the above student, even though the percentage correct is below 50%. Shell need to investigate further, but the other two data points indicate that the real culprit may be rushing and making careless mistakes.
- Average timing that is 30 seconds (or more) higher or lower than the expected average. The above student is edging high on correct CR. Incorrect RC might be highor it might be that she happened to miss a higher proportion of first questions for a passage (for which the time spent includes the initial reading time).
- A big discrepancy (more than 30 seconds) in average time for correct vs. incorrect questions of the same type; its normal to spend a little extra time on incorrect questions (because those are probably the harder ones!), but not a tonthat just means youre being stubborn.
Take a look at the data for the Quant sub-topics listed at the bottom of the report. Notice any issues?
Geometry has a low percentage correct but is also super-fast. Maybe she just hasnt studied geometry yet? (Indeed, I know that is true for this student. :) ) If you havent studied it yet, then ignore that data; it doesnt matter right now.
Number Properties also has a low percentage correct but quite high time on the incorrect ones. The difficulty level for those is also by far the highest, so it makes sense that shed have been tempted to spend extra timebut this is another example of where she needs to learn to cut herself off. She lost an average of 41 seconds on 4 problems, or 164 seconds total. Thats 2 minutes, 24 secondsmore than one entire problems worth! She could have used that time elsewhere.
Question Format & Difficulty
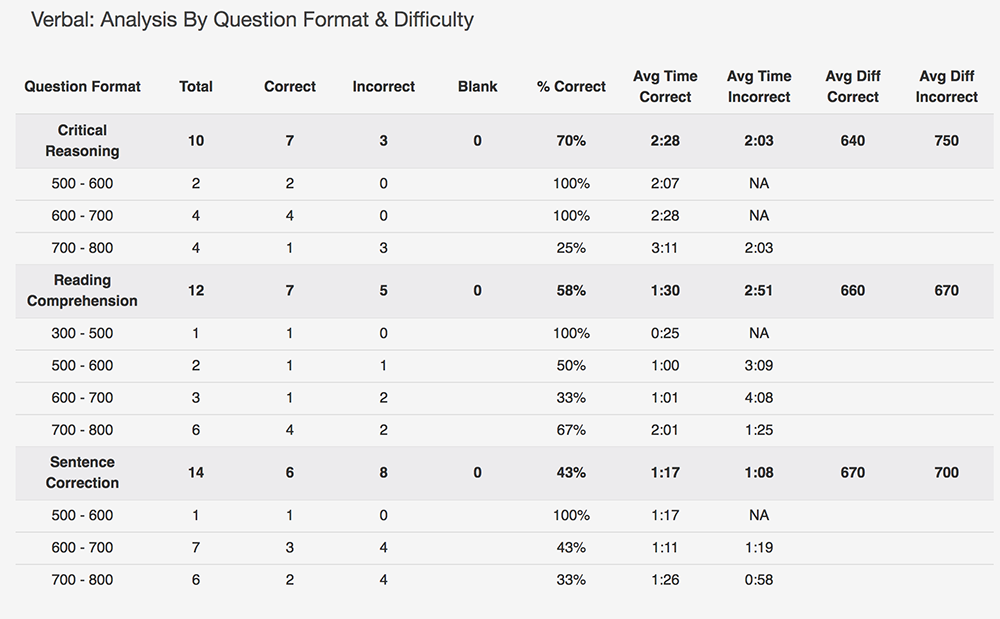
The second and third reports sort the questions by Question Format and Difficulty. Heres an example of the Verbal report:
Spot anything?
The student has a very high percentage correct on CR, though she did have to spend some extra time to get there. Where did that time come from? Incorrect SC and some RC. (The latter is hard to see from the report because it doesnt have a separate category for reading time. But 4 passages and 12 questions should typically add up to around 28 minutes and she spent just under 25 total on RC.)
It can be okay on verbal to have one question type take longer than average if one or both of your others are faster than averageand if that speed is not costing you points. Shell need to analyze to see whether she had any careless mistakes on SC or RC. Id start that analysis with SC; RC still had a higher percentage correct, but SC was lower.
It would also be a good idea for her to spend some time reviewing the correct CRs to learn how she can streamline her process. If she can still get those problems right in, say, 2m10s on average rather than 2m28s, thats a lot of time to spend elsewhere!
In the Question Format & Difficulty reports, look for:
- average timing that is 30 seconds (or more) higher or lower than the expected average, and whether that is happening on correct or incorrect questions, or both (and note that you may have to do some deeper investigating on RC, due to reading time)
- lower percentages correct on lower-level questions than on higher-level questions
As before, look at the data points across these categories together. You might be spending too much time on incorrect higher-level questions and not enough time on lower-level questions (that you then get wrong because youre rushing).
This student had a lower percentage correct for RC 600-700 than RC 700-800. The number of questions is small for 600-700, so this may not mean muchbut its something to keep an eye on.
In fact, this is her third practice test, so she can go keep an eye on that right now. Re-run the reports using the last two tests vs. just this one. How does the picture change?
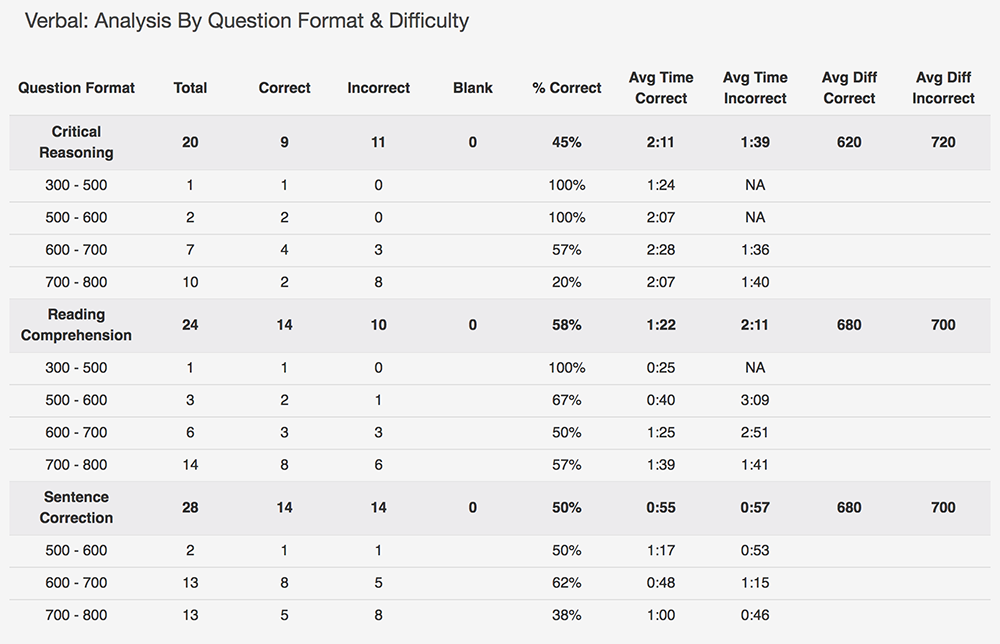
Wow! The RC percentage correct is the same, but CR changed drastically. And SC bumped up a bit. What are the messages here?
First, she significantly improved the percentage correct on CR from test 2 to test 3thats good in general, although her average timing also increased. Its possible that she really dove in and worked on CR between these two exams, and her efforts paid off in terms of accuracy but she still has some more work to do as far as efficiency is concerned.
She is still missing 600-700 level RC more than 700-800 level, so shell likely want to dive into those questions to figure out why. Is she falling into some traps? Are there certain question types that shes weaker at (and she happened to get those more at the 600-700 level on these two tests)?
One big concern is that the percentage correct for SC is trending down though the difficulty levels were about the same on both tests. Shell want to examine why when she does her individual question review.
Speaking of that individual question review, join us next time when well dive into the final batch of reports: Content Area & Topic data for both Quant and Verbal.